使用jChart生成统计折线图的方法
面向JAVA的报表绘制软件开源的选择非常多,http://java-source.net/open-source/charting-and-reporting上列出的都是不错的选择.但是虽然都是开源的产品,但是文档和教程就差距很大.发现很有意思的是做的非常棒的基本上都吧文档/教程放到了amazon上卖,也是不错的养活开源项目的思路,但是这样一来对这个项目的评估开发者只能非常无奈的看看提供的截屏了.凌晨花了两三个小时,把jasperReport,jFreeChart,JCCKit,jChart都考察了一遍,前两个都是比较完善的产品,生成的图表种类多,效果可以用绚丽来形容,输入格式也很多,虽然报以厚望,但是文档奇缺,样例代码太少而且语焉不详,加之悟性不高,临渊羡鱼罢了.JCCKit的文档算是全面,但是用户手册却同样让我无法下咽,都是动画图表生成,劳伦斯曲线...(没看懂),基本的折线图,柱状图却没找到.幸好,剩下的选择jChart最终提供了不错的文档和非常具体的样板代码,而且就是我想要的用servlet生成图表.
图表的生成肯定离不开数据,上面的都提供了对数据的抽象,像dataSet类似的名字.在需要生成图表的统计平台上,数据从数据提取然后填充到报表需要的数据集合中.除此以外,报表的名字,字体,坐标分隔,颜色,坐标点的样式可以选择性的通过property的方式配置完成,剩下来的事都可以交给图表库去操作了.
下面的代码基本上发布的示例中的,添加了一些配置而已,在调用前将对应的数据生成好,go!
LegendProperties legendProperties = new LegendProperties();
legendProperties.setNumColumns( 8 );
ChartProperties chartProperties = new ChartProperties();
AxisProperties axisProperties = new AxisProperties( false );
ChartFont axisScaleFont = new ChartFont( new Font( "SansSerif", Font.PLAIN, 12 ), Color.black );
axisProperties.setXAxisLabelsAreVertical( true );
axisProperties.getXAxisProperties().setScaleChartFont( axisScaleFont );
axisProperties.getYAxisProperties().setScaleChartFont( axisScaleFont );
((DataAxisProperties) axisProperties.getYAxisProperties()).setNumItems( 15 );
ChartFont axisTitleFont = new ChartFont( new Font( "SansSerif", Font.PLAIN, 12 ), Color.black );
axisProperties.getXAxisProperties().setTitleChartFont( axisTitleFont );
axisProperties.getYAxisProperties().setTitleChartFont( axisTitleFont );
//Stroke[] strokes= { LineChartProperties.DEFAULT_LINE_STROKE, LineChartProperties.DEFAULT_LINE_STROKE, LineChartProperties.DEFAULT_LINE_STROKE };
//Shape[] shapes= { PointChartProperties.SHAPE_TRIANGLE,PointChartProperties.SHAPE_DIAMOND, PointChartProperties.SHAPE_CIRCLE };
Stroke[] strokes = new Stroke[legendLabels.length];
for (int i = 0; i < strokes.length; i++) {
strokes[i] = LineChartProperties.DEFAULT_LINE_STROKE;
}
Shape[] shapes = new Shape[legendLabels.length];
for (int i = 0; i < shapes.length; i++) {
shapes[i] = PointChartProperties.SHAPE_DIAMOND;
}
LineChartProperties lineChartProperties = new LineChartProperties(strokes, shapes);
//String[] xAxisLabels= { "1998", "1999", "2000", "2001", "2002", "2003", "2004"};
//String xAxisTitle= "Years";
//String yAxisTitle= "Problems";
//String title= "Micro$oft At Work";
DataSeries dataSeries = new DataSeries( xAxisLabels, xAxisTitle, yAxisTitle,title );
//double[][] data= TestDataGenerator.getRandomNumbers( 3, 7, 200, 500 );
//String[] legendLabels= { "Bugs", "Security Holes", "Backdoors" };
Paint[] paints= TestDataGenerator.getRandomPaints( legendLabels.length );
AxisChartDataSet acds = new AxisChartDataSet(data, legendLabels, paints,ChartType.LINE, lineChartProperties );
dataSeries.addIAxisPlotDataSet(acds);
AxisChart axisChart = new AxisChart(dataSeries, chartProperties, axisProperties,legendProperties, 1024, 768);
ServletEncoderHelper.encodeJPEG13(axisChart, 1.0f, response);
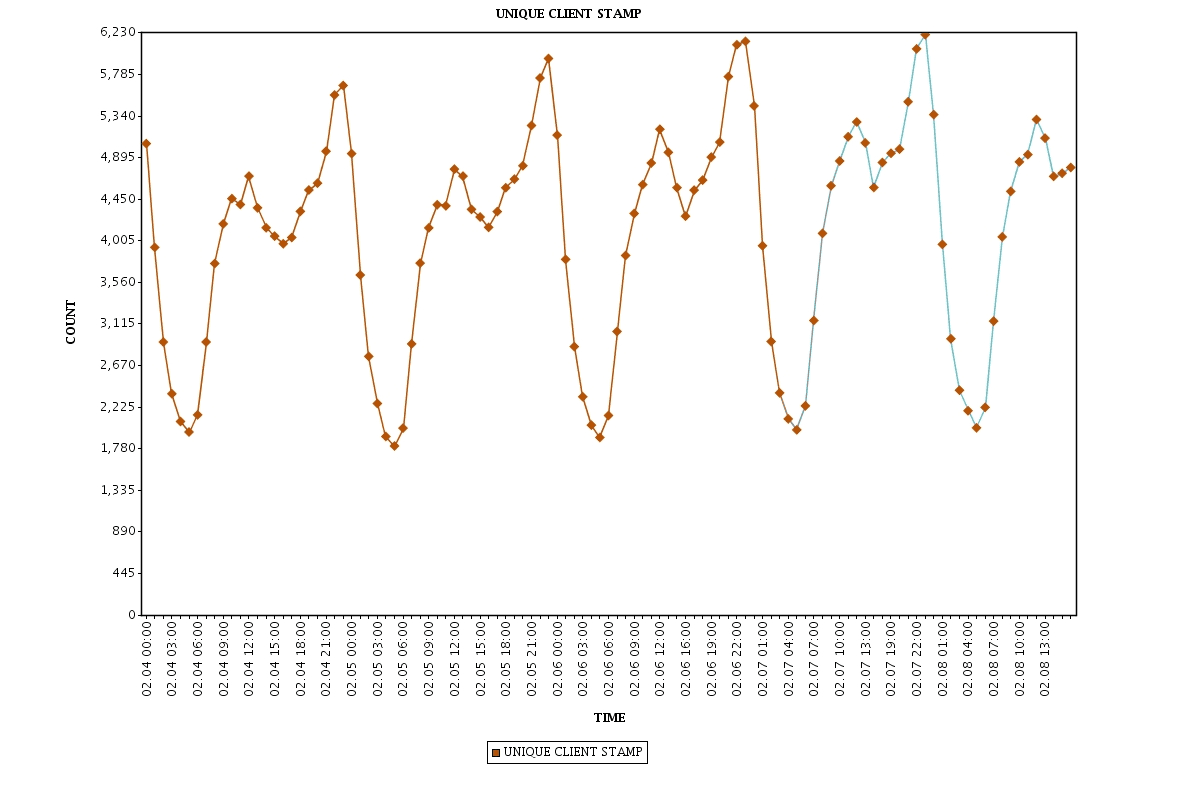
下面是输出的一张图,后面的变色不是预期的,而且好像不是总能出现.

本文地址:http://www.45fan.com/dnjc/68913.html
